
When an Italian consumer types in“washing machines” on an electronics e-commerce site, within seconds he sees a list of products, signs and brands parade by. That screen is today’s real digital selling point: those who man that window intercept qualified traffic; those who stay out of it disappear from the buyer’s radar. For the Digital, e-Commerce and Trade Marketing teams of industrial companies, figuring out who occupies that SERP-and with what products, signs and prices-has become as much a strategic requirement as reading a flyer or shelf display.
QBerg has released the Share of Keyword (SoK) module within the QPoint suite specifically to address this need. This tutorial operationally explains what SoK is, how the platform captures the top 20 SERP results on target sites, what QPoint-style operations you can do on the dataset, and what business questions it solves. You won’t find fictitious percentages or simulated cases-the goal is to guide you through the search setup, show you what you see on screen, and make you understand why SoK opens up a new level of price intelligence on the search channel.
What is Share of Keyword: the definition
The Share of Keyword is the share of visibility that a brand, product or sign gets within the search results page (SERP) of an e-commerce website against a specific keyword set by the client.
It is not a traditional SEO metric (average ranking, domain authority, estimated traffic): it is a competitive measure of commercial SERP garrison, built with the same methodological logic with which QBerg, for more than twenty years, has been measuring the share of visibility on the printed flyer, physical store, or promotional web monitoring. Just as on the flyer we count and weight the spaces occupied by each brand, on the SoK we count how many SERP slots a sign or brand occupies when consumers type in a purchase keyword.
The added value is transformation: the SERP stops being a mutable page and becomes a structured dataset, comparable over time and analyzable by multiple dimensions, within the same QPoint experience you already know.
How capture works: top 20 results on target sites
The collection mechanism is deliberately simple to set up, but robust in terms of methodology. The operational flow consists of five steps:
- Keyword setting. The client chooses one or more keywords to monitor. These can be generic category keywords (“washing machines,” “refrigerators,” “smartphones”), brand-driven keywords (“Bosch washing machine”), occasion-of-use keywords (“slim washing machine,” “9 kg washing machine”) or long-tail verticals (“class A inverter silent washing machine”).
- Definition of target sites. La queries the sites relevant to the client’s competitive perimeter – the leading GDS e-commerce, category specialists, marketplaces, online pharmacy or pet specialist, depending on the industry.
- Capturing the top 20 results. For each keyword, the system picks up the first 20 SERP results detected on the target sites. This is the window where almost all purchase clicks are concentrated: beyond that threshold, competitive visibility is effectively zero.
- Data normalization and enrichment. Each result is traced back to brand, model, EAN/product code, host sign, on-screen price, presence of active promotion. It is at this point that the data becomes a QPoint-style asset: queryable, filterable, segmentable.
- Repetition over time. The capture is relaunched with the frequency defined in setup. It is the time dimension that transforms the SoK from an instantaneous snapshot to a continuous observatory of the SERP garrison.
The guiding principle is the same as for the entire QPoint suite: structured, repeatable and comparable data, never an extemporaneous snapshot.
What you see on the screen: from SERP to dashboard
Once you launch the capture on the keyword“washing machines,” the QPoint interface dedicated to SoK returns the SERP to you as a browsable dataset, not as a web page. Specifically you display:
- The list of the top 20 results intercepted on the target sites, with the position occupied by each product within the individual site’s page.
- The attribution of each result to ahost brand (those who display the product) and an industry brand (those who produce it).
- The on-screen price and any active promotion, where detected.
- The distribution of SoK, that is, how many slots of the top 20 are occupied by each brand, each sign, or each brand × sign × price combination.
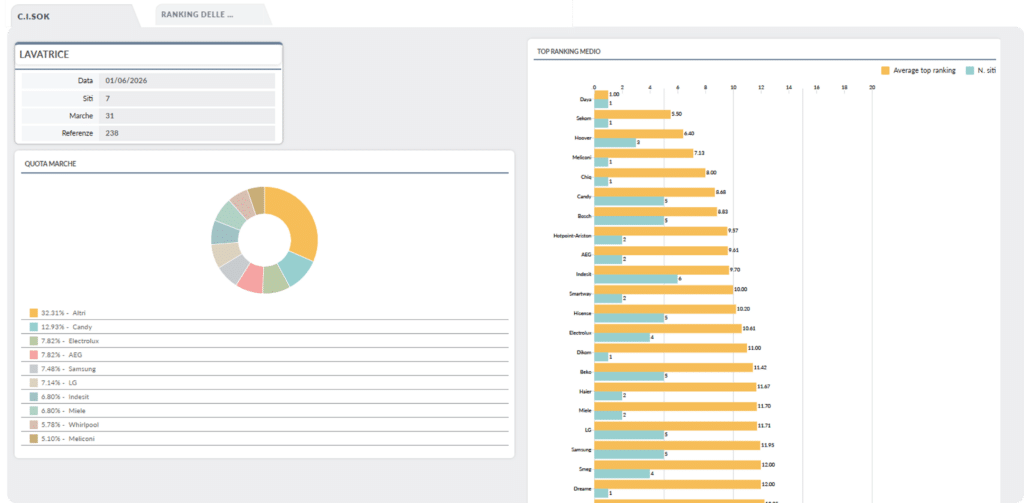
At a glance you understand who is winning the SERP for “washing machines” on your competitive perimeter: which industry brands are manning the visibility window, which signs are hosting them, at what price level, with what promotional intensity.
QPoint-style operations on the SoK dataset.
The real jump in value occurs when you start querying the dataset. On the SoK you can apply the same set of operations that you already use on the other QPoint modules:
- Filters. You isolate one sign, one brand, one price range, one product type. Example: I only see slots of “washing machines” showing models above 600 euros at non-specialist GDO signs.
- Perimeter comparisons. Compare your brand’s SoK against a direct competitor, or the SoK on two sign clusters (pure player vs. multichannel GDO, for example), or even on two related keywords (“washer” vs. “washer-dryer”).
- Trend over time. Visualize the trend of visibility share in SERPs week by week, month by month. Understand when a competitor launches a campaign that earns it slots and when, conversely, it loses garrison.
- Segment by sign or brand. Pivot the dataset by host sign (who is the retailer that is giving me the most or least visibility?) or by industry brand (what is my SERP share relative to major category competitors?).
- Cross-check with other modules. The SoK dialogues natively with the other modules in the suite: compare presidium in SERP with presidium on the flyer (QPoint Flyer), with monitored prices one-commerce (QPoint Web) or with multichannel comparison (QSearch). This is where price intelligence becomes truly omnichannel.
What business questions does it solve
SoK is not a metric for its own sake: it is a decision-making tool. The typical questions it answers, on the table of a Digital Manager, Industrial e-Commerce Manager or Trade Marketing, are concrete and operational:
- For industrial branding: how many slots of the top 20 do I occupy in strategic keywords in my category? How many does the main competitor occupy? On which keywords am I underrepresented relative to my physical market share?
- For the trade relations manager: which signs give me the most visibility in SERPs on key keywords? Is my digital presence at retailer X consistent with agreed trade agreements?
- For pricing: at what price levels do my products appear in the top 20 results? Are there price range “holes” where my range is absent and competitors preside?
- For marketing: when I launch a promo campaign or a new product, can I measure the lift in SERP visibility that the campaign generates? Is the promo actually moving my Share of Keyword?
- For sales management: is my brand gaining or losing ground on the search channel, regardless of what happens on the physical store or flyer?
These are questions that, until yesterday, could only be answered by extemporaneous manual checks or generalist SEO tools designed for other purposes. SoK makes them measurable in a structured, repeatable and comparable way within QPoint.
| Elemento | Cosa imposti / Cosa ottieni |
|---|---|
| Input keyword | Una o più parole chiave di categoria, brand o long-tail |
| Perimetro siti | Siti target rilevanti per il settore (GDO online, specialisti, marketplace) |
| Profondità cattura | Primi 20 risultati di SERP per ciascun sito target |
| Dimensioni di analisi | Brand, insegna, prezzo, promo, modello, EAN |
| Operazioni disponibili | Filtri, confronti, trend nel tempo, segmentazioni, cross-modulo |
| Output principale | Quota di visibilità in SERP per brand, insegna o combinazione |
| Domanda strategica risolta | Chi presidia il canale ricerca sulle mie keyword di business? |
Why SoK is a key piece of price intelligence
For years, QBerg has upheld a principle: the scope of retail observation is no longer separable by channel. Consumers compare the paper flyer, the shelf, the store’s website, and Google results within minutes. It is no longer enough for marketers to preside over one touchpoint: they need an omnichannel view.
The SoK closes a link that the QPoint suite was missing: the search dimension. Together with QPoint Flyer (flyer), QPoint Web and QPoint Web PROMO (e-commerce and online promo), QPoint Store (point of sale) and QSearch (multichannel comparison), the SoK ensures that every lever of visibility in modern retail is observed with the same rigorous methodology. This is how price intelligence stops being a reporting exercise and becomes a concrete guide to business decisions.
Conclusion: from SERP to competitive advantage
The Share of Keyword is a tutorially simple tool-set the keyword, choose the sites perimeter, read the top 20 results as a dataset-but strategically powerful. It turns a Google page into a measure of competitive garrison, as replicable and comparable as any other QPoint KPI.
For the Digital Manager it is a compass on the search channel. For the Industrial e-Commerce Manager, it is a thermometer of one’s visibility in the banner marketplaces. For Trade Marketing it is a transparent check on consistency between trade agreements and actual visibility. For management it is a new layer of market intelligence within an increasingly decisive omnichannel perimeter.
The SoK is the starting point. From there, more vertical tutorials open up–on how to use it in new product launches, in negotiations with the trade, in monitoring promotional campaigns–which we will explore in more detail in future content.
Want to see the Share of Keyword module applied to strategic keywords in your category? Request a customized demo of QPoint SoK and find out how to measure your SERP garrison.