

FMCG MARKET - 25 May 2026
From “cheap” alternative to pillar of trust: the historic turning point of MDD
Data presented at Marca by BolognaFiere & ADM 2026 mark a point of no return. Circana’s XXII Marca Report and The European House – Ambrosetti position paper for ADM deliver evidence to operators that redefines the business strategies of Italian FMCG: in 2025, the Retailer Brand developed a turnover of 31.5 billion euros (+6.8% year on year) and broke through the wall of 30% value market share in omnichannel perimeter for the first time (30.4%, +0.5 p.p. vs. 2024).
It is not “just” quantitative growth. It is a change in competitive positioning. The Italian consumer no longer chooses MDD to fall back on minimum price: he chooses it because he trusts it. Nine out of ten Italians say they trust private label products, and the segments that drive the sector are no longer first prices (growing marginally) but mainstream, organic, and premium.
For FMCG category managers, pricing managers, and trade marketing managers, this means only one thing: the pricing, assortment, and promotional visibility models built over the past decade need to be revised. MDD is no longer the “discount competitor” to be looked down upon. It is a brand guarantor playing on the same field as industrial brands, with progressively more sophisticated differentiation levers.
Just considering the classical GD perimeter formed by Iper, Super and Superette, MDD’s share growth stands at 23 percent, for a turnover worth 16.6 Bn.

(years 2019-2025, sell-out share)
In this article, we go into the details of the phenomenon with a dual vantage point: the scenario data presented at Brand 2026 and-most importantly-QBerg proprietary evidence on price differentials and Private Label’s share of promotional visibility by product category.
Brand 2026’s numbers: an industry running twice as fast as the market
The TEHA-Ambrosetti report for ADM, presented on January 14, 2026 in Bologna, captures a phenomenon that is growing structurally, not cyclically. We summarize the key indicators for those operating in FMCG:
- MDD 2025 turnover: 31.5 billion euros, up 6.8 percent on previous year
- Omnichannel value share: 30.4% (+0.5 p.p. vs. 2024)
- Value share in traditional retail (Hyper, Super, Superette): 23.1 percent, up from 22.4 percent in 2024, for a turnover of 16.5 billion
- Volumes: up 4 percent nationwide, with double-speed increases in the South and Islands
- Cumulative savings for Italian households (2020-2025): about 22 billion euros, or 150 euros per year per household
- Assortment incidence: MDD now weighs 17.4% of shelf assortment, up 5 points from 2015
There is one detail that deserves strategic reading. In 2025 , MDD prices grew +1.4%, more than the branded industry. Translated: private label is reducing dependence on discount leverage and building value through premiumization. Functional products (organic, free-from, enriched) grow +19% in value. “First price” lines are up only +3%, and are no longer the growth engine.
TEHA’s Benedetta Brioschi puts it bluntly: MDD is now a value choice, no longer a convenience choice. For industrial brands, this is a sign that competition is being played out on a different level than on the shelf a decade ago.
The QBerg observation point: beyond the summary data
The Ambrosetti data tells the what. The real then? – what every category manager must bring to the CDA-emerges by cross-referencing the scenario data with timely monitoring of promotional and price positioning by category. This is exactly the territory in which QBerg operates.
Through the In-Store POINT Flyer and In-Store POINT Web suites, we constantly monitor how MDD is positioned on the flyer and online relative to industrial brands. Evidence from our database shows that the value market share told by Circana is only the tip of the iceberg: at the level of promotional visibility-measured through our proprietary QP3 indicator-Private Label has already conquered territories where the value share will reach in the next 24-36 months.
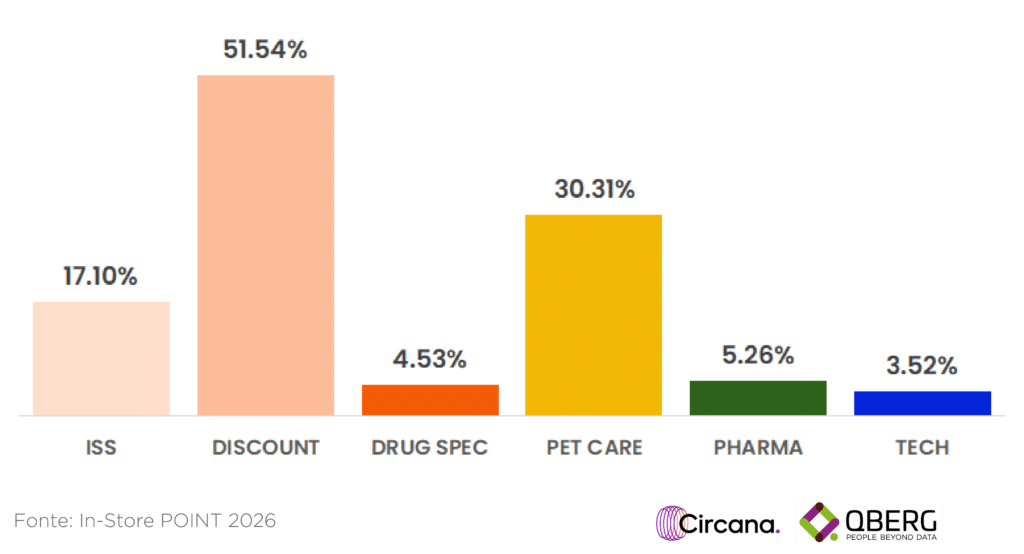
(year 2025; Share Qp3)
Let’s look at cross proprietary data by channel:
- Traditional retail (Iper, Super, Superette): MDD reaches 17.1% flyer share, representing the “mature” channel.
- Discount: MDD comes in at a staggering 51.54%, thus representing the real mainstay of this Channel;
- Drug specialists: we are at a more moderate 4.53%.
- Pet Care: PL holds 30.31% QP3 visibility on 2025 flyers, with rotation dynamics, however, seeing recent erosion (-12.7 p.p. in the accessories segment, where top brands are coming back aggressively).
- Italian pharmacies and parapharmacies, corner pharma GD: we are at 5.26% visibility share in these flyers;
- Tech / Durable Goods: PL touches 3.52% flyer share . An emerging phenomenon, led by Unieuro, Euronics, Expert and Mediaworld, on categories such as small appliances, electric mobility and air treatment.
What the aggregate figure does not say is that MDD is advancing in historically difficult channels (pharmacy, tech) and is structuring itself at different speeds. For an industry brand, understanding where PL is growing and where it is consolidating is the difference between a timely countermove and a passively suffered erosion.
Brand vs. MDD price differential: the real playing field
There is a second element that the summary data does not tell: the price differential between branded industry and private label is gradually narrowing, but unevenly by category. Premium MDD is moving closer to the leading brands; first-price MDD is trying to keep its distance from the discounters.
For a Pricing Manager, this means that the price range is no longer a static metric to be surveyed once a quarter. It is a dynamic metric that varies by:
- Macrocategory (food, personal care, home care)
- Price segment (mainstream, premium, first price)
- Channel (Hyper, Super, Superette, Discount, e-commerce)
- Teach (very heterogeneous assortment and pricing policies)
- Promotional period (in/out flyer, price cuts, multi-buy)
QBerg monitoring, through the In-Store POINT platform transforms data into competitive advantage.
What it means, operationally, for industry and retail
The picture that emerges from the intersection of Brand 2026 data and QBerg monitoring has concrete implications for those running a category P&L:
For leading industrial brands: the aggregate promotional pressure of Top10 manufacturers is declining in the main channels monitored. It means that the freed promotional space is rapidly occupied by MDD and aggressive followers. The risk is a progressive loss of share of voice on the flyer, which precedes the loss of value share by 12-18 months.
For retailers: MDD is no longer an “easy” margin lever. Consumers expect quality, consistency with the sign’s values, and a distinct brand identity. The signs that are growing the most are those that have structured PL as a true brand, with identifiable premium, organic, and functional lines.
For Pricing Managers: the Brand vs MDD differential should be monitored continuously, not after the campaign is over. MDD pricing grows more than industry pricing, and this opens, for premium brands, repricing windows to be seized with timing. For mainstream brands, it is time to review price architecture and promotional intensity before the spread closes for good.
For Trade Marketing Managers: visibility share on flyer (QP3) and online should be negotiated by category, not by total sign. QBerg data show huge differences between macrocategories: where PL is leading (e.g., Pharmacy Personal Care at 12.48%, Pet Specialist at 35%) negotiating prime position becomes crucial to not disappear from consumer radar.
From data to action with the In-Store POINT suite
Turning these insights into profitable decisions requires structured, up-to-date, cross-channel data. QBerg and Circana’s In-Store POINT suite provides:
- In-Store POINT Flyer: monitoring flyer campaigns of all channels (GDO, Drug Specialists, Discount, Cash&Carry, Pet Specialist) with QP3 measurement of promotional pressure
- In-Store POINT Web: price and assortment detection on major e-commerce with up to hourly frequency
In a market where the Distributor Brand has ceased to be an alternative and has become a pillar of trust, navigating by sight is no longer an option. Continuous, granular and actionable data are needed.
Want to measure the price differential and visibility share of MDD in your categories?
Request a customized demo of the In-Store POINT suite and learn how QBerg transforms data into competitive advantage.
Questo studio è stato realizzato con In-Store POINT, la nuova piattaforma di price intelligence per il monitoraggio multicanale di prezzi e assortimenti. Con In-Store POINT diventa semplice e intuitivo monitorare i volantini promozionali, i siti di e-commerce e le newsletter.
Contattaci per saperne di più.