


DURABLE GOODS MARKET - 25 May 2021
PRICES CONTINUE TO RISE IN OCTOBER.
PRICES FOR SMARTWATCHES, CAMERAS, LAPTOPS, AND CELL PHONES REACH ALL-TIME HIGH
A YEAR-OVER-YEAR INCREASE IN IPT NOT SEEN IN NEARLY THREE YEARS. THE FOOD & HOME TECHNOLOGY SECTOR CONTINUES TO STRUGGLE. ONLY BUILT-IN WASHING MACHINES AND RANGES ARE PRICED HIGHER THAN A YEAR AGO
+0.56
OCTOBER 26
vs. WEEK 26
104.22
IPT Index
OCTOBER 26
+1.79
OCTOBER October 26:
vs. OTT25
Chipflation continues to drive price increases: for the ninth consecutive month, cell phone prices have reached all-time highs; for the second consecutive month, prices for laptops and camcorders have done the same; while flat-screen TVs have seen their largest price increase in the past twelve months.
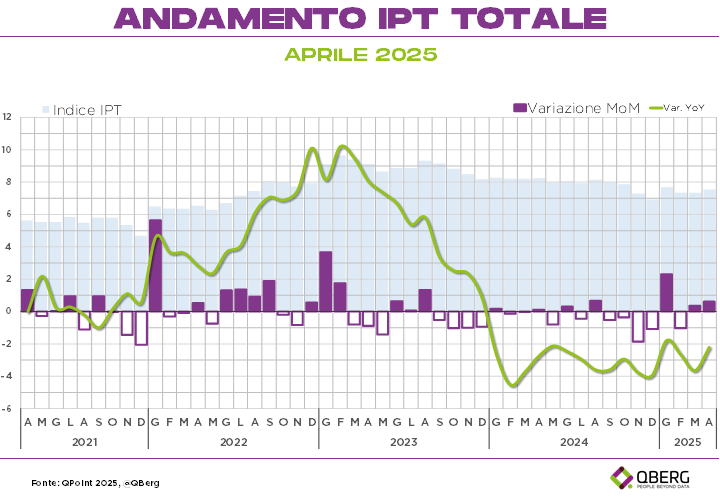
The effects of price increases across digital technology product segments have pushed the Technology Price Index (IPT) to 104.22 —a level not seen since November 2024.
Specifically, the IPT rose by 0.56 points between September and October, and showed a more substantial increase of 1.79 IPT points between October 2026 and October 2025— a year-over-year increase not seen since November 2023.
The only factor holding back the rise in prices of technology products comes from segments within the Food & Home Technology sector, where prices for cappuccino makers, freestanding freezers, steam cleaners, dryers, and washing machines have hit all-time lows (for the second consecutive month). Within Food & Home Technology, only built-in washing machines and ranges have prices higher than those of twelve months ago; for all other eighteen segments, the average prices recorded by QBerg are lower than those of October 2025.
DIGITAL TECHNOLOGY
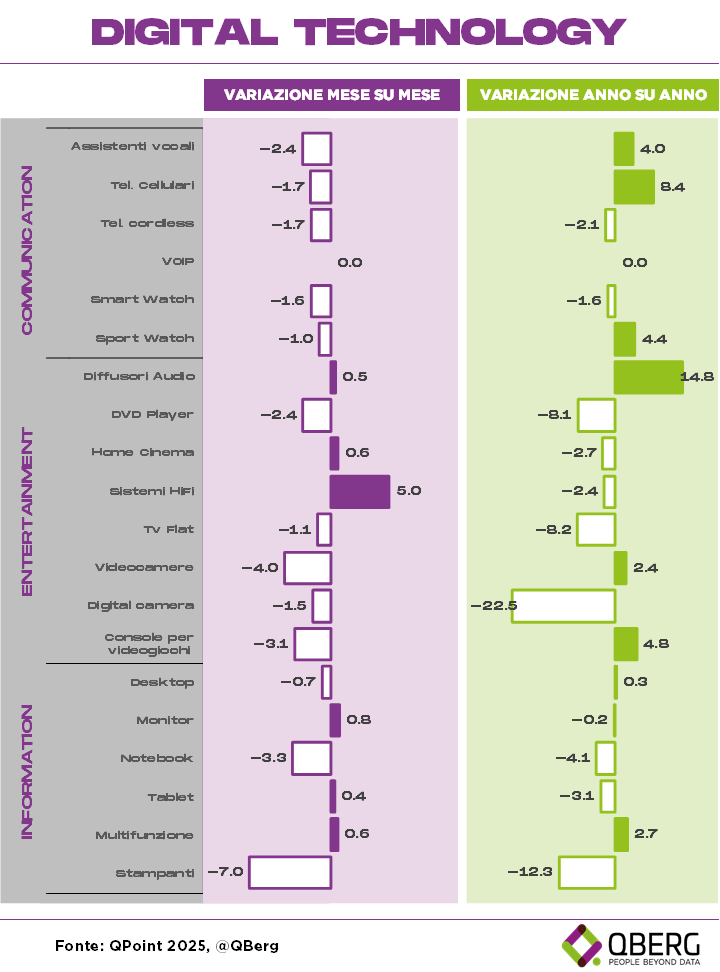
It is undoubtedly the Digital Technology product segments that are driving the rise in the IPT index.
Apart from the declines in Voice Assistants (-51.3 IPT points), video game consoles (-11.9), and a 1.0-point decline in the IPT for monitors and digital cameras, all fifteen other Digital Technology product segments showed price increases in October compared to September.
Specifically:
- In October, compared with September, the sector with the least impressive year-over-year price trends—after Digital Technology—wasEntertainment. In addition to record increases in video cameras (+11.4 IPT points month-over-month), there were also, compared to September, increases of +1.2 points for TV Flat-Rate Plans and Hi-Fi Systems, +2.3 points for DVD Players, and +4.7 IPT points for Audio Speakers and Home Theater systems. Only camcorders (+25.4) and, by a narrow margin, flat-screen TVs (+0.2 IPT points) are priced higher than in October 2025; the other segments show declines: -8.4 points for digital cameras and audio speakers, -4.5 for home theater and hi-fi systems, while only DVD players are close to price parity (-0.4);
- Prices in the Communications sector are also on the rise, thanks in part to all-time highs for cell phones (+3.8 month-over-month and as much as +30.6 year-over-year), smartwatches (+7.0 and +8.9 compared to a year ago), and sports watches (+2.7 and +8.7), as well as cordless phones (+0.8 and +2.3 year-over-year). It is also worth noting that, despite a record month-over-month decline (-51.3 IPT points), voice assistants are still significantly more expensive than they were twelve months ago (+34.6);
- theInformation Technology sector, despite being significantly impacted by chipflation, is showing relatively modest price increases. With the exception of Monitors (-1.6, the only segment in the sector with month-over-month price declines) and Multifunction Printers (+1.0), all other product segments (tablets, desktops, notebooks, and B&W printers) have seen increases ranging from +2.0 to +3.0 IPT points. Compared to twelve months ago, however, only B&W Printers have lower prices (-13.5 IPT points); all other segments are in positive territory, albeit to a relatively modest extent: Tablets (+0.1), Monitors (+1.2), and Multifunction Printers (+2.5), while Desktop PCs and Notebooks recorded double-digit increases (+11.7 and +14.8 IPT points, respectively, compared to October 2025).
WELLNESS TECHNOLOGY
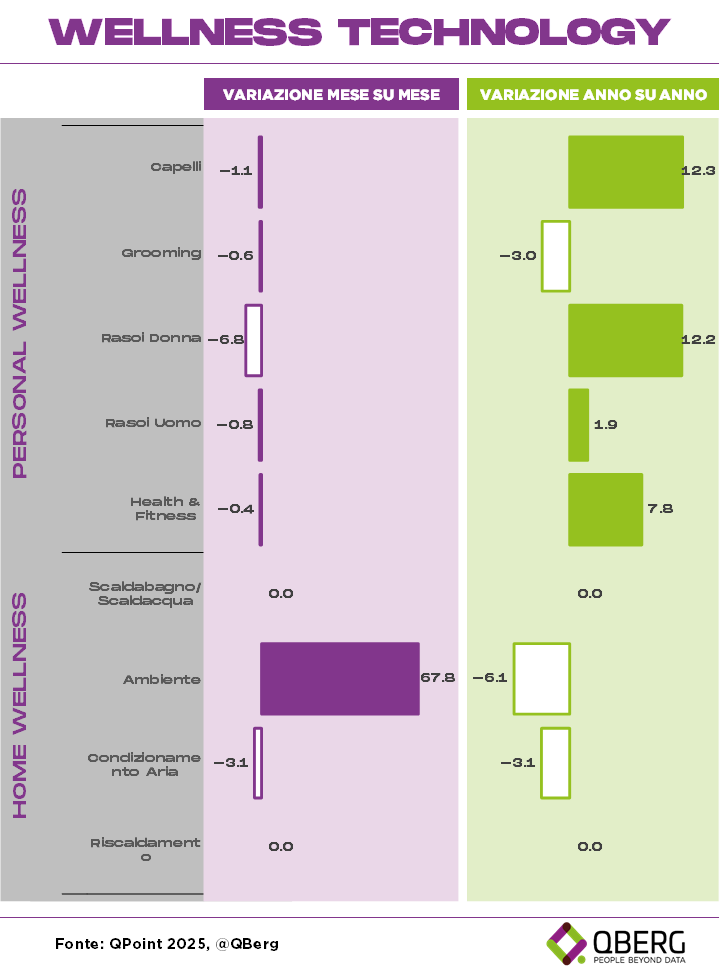
Prices in the Wellness Technology sector are declining.
Compared to September, it is true that prices for hair care and air conditioning products are rising, but there are also price declines for grooming products (-0.2) and for both men’s (-4.0) and women’s (-2.4) razors, while prices for heating products remain unchanged from September.
The extremely sharp decline in prices for environmental products deserves special mention (-75.4 IPT points compared to September and -15.9 compared to a year ago): this year’s decline was so sharp that it pushed the average price of products in this segment back by nearly five years.
Compared to October 2025, with the exception of Air Conditioners (+4.1 IPT points compared to October 2025), all other segments are declining: slightly for Health & Fitness Smartwatches (-0.6) and Men’s Razors (-1.1), while the declines are more pronounced for Hair and Grooming products, -2.6 points, women’s razors (-5.0), and heating products (-7.1).
FOOD & HOME TECHNOLOGY
As in the past two months , October 2026 also saw negative, though modest, changes for the Food & Home Technology sector.
Compared to September, only five segments—such as Refrigerators and Cooking Apps (both +0.3) Ovens (+0.7), Cooking Appliances (+0.2), and Vacuum Cleaners (+0.1) saw slight price increases, while Cooktops and Built-in Washing Machines showed no price changes.
For the other twelve product segments in the sector, negative month-over-month changes were recorded, though they were modest:
- Below -1 IPT point: both freestanding and built-in dishwashers, freezers, microwave ovens, steam cleaners, and washing machines;
- Average prices for ranges, built-in refrigerators, cappuccino makers, irons, and dryers, while only coffee machines (-3.1 IPT points) recorded more pronounced month-over-month declines.
The year-over-year comparison clearly highlights the ongoing difficulties in the Food & Home Technology sector.
Only two product segments—Kitchens (+3.4) and Built-in Washing Machines (+4.9 IPT points)—show prices higher than those of twelve months ago.
All other segments show lower prices compared to October 2025:
- between -5.0 and -7.6 IPT points for dryers, kitchen appliances, freezers, cooking appliances, and refrigerators;
- between -3.5 and -5 points for steam cleaners, built-in freezers, irons, built-in dishwashers, washing machines, ovens, and coffee makers;
within a range of -0.5 to -3.0 IPT points compared to the October 2025 price for vacuum cleaners, built-in refrigerators, cooktops, microwave ovens, cappuccino makers, and dishwashers.

CONCLUSIONS
The prices of gasoline, diesel for transportation and heating, the inflation they are causing, and social tensions are driving up not only product prices but also the concerns of businesses and households in these final months of 2026.
The prevailing economic uncertainty certainly does not encourage purchases, nor does it make life easier for tech retailers, who are already grappling with “chipflation”—a phenomenon driving up prices in key digital product segments that are crucial to their revenue, such as smartphones, laptops, desktop computers, and flat-screen TVs.
Meanwhile, November is fast approaching—a month in which, over the past four years, prices have fallen thanks to Black Friday.
Stay tuned!
Methodological Note
The QBerg Price Observatory aims to highlight price trends in the technology sector at brick-and-mortar stores (STORE) in Italy. The Price Observatory is based on the Technology Price Index.
The Technology Price Index (IPT) is a composite indicator (base: January 2022 = 100) that measures changes over time in the prices of a set of 16 categories and 54 subcategories of technology products (see attachment) that Italian consumers can purchase at physical retail locations across three different channels: electronics chains, electronics buying groups, and hypermarkets.
Prices for technology products are tracked monthly by QBerg’s field network at 270 retail locations across 19 regions nationwide.
The overall IPT is calculated by aggregating all prices for all brands across all 16 product categories and 54 subcategories displayed in the retail locations surveyed monthly, and then calculating the average of all those prices.
This aggregation allows for the analysis of the data by:
– Absolute Composite Indicator (IPT)
– Month-over-month change in the IPT (change in the IPT index compared to the previous month)
– Year-over-year change in the IPT (change in the IPT index compared to the same month of the previous year)
– Monthly and year-over-year changes by product category and subcategory
The IPT is released in the last week of each month.
The public health emergency caused by the spread of COVID-19 and the related Prime Ministerial Decrees prevented price data collection in April 2020.
Questo studio è stato realizzato con QPoint, la nuova piattaforma di price intelligence per il monitoraggio multicanale di prezzi e assortimenti. Con QPoint diventa semplice e intuitivo monitorare i volantini promozionali, gli scaffali dei punti vendita fisici, i siti di e-commerce e le newsletter.